
Trading Strategies · Strategies
Indicators for Day Trading
Day trading indicators help you decide which stocks are worth trading and where to enter and exit. Each one shows something useful, and each one has a blind spot.
Key takeaways
- First pick the right stock: high liquidity, strong relative volume, enough range (ATR), tight spreads and a catalyst.
- VWAP, short EMAs and key price levels (pre-market high and low, support and resistance) are the backbone of many intraday charts.
- RSI, MACD and Bollinger Bands describe momentum and stretch, but they are built from past prices and lag.
- ATR tells you how far a stock normally moves, which helps set stops and position size.
- Use a few indicators you understand well. Indicator overload leads to conflicting signals and hesitation.
What are day trading indicators?
Day trading indicators are calculations based on a stock’s price and volume, plotted on an intraday chart (for example a 1-, 5- or 15-minute chart) to help you judge trend, momentum and likely turning points. They do two jobs: helping you choose which stocks to trade today, and helping you time entries and exits in those stocks.
No indicator predicts the future. Every one is derived from prices that have already printed, so treat them as ways to organize what the chart is telling you, not as signals to follow blindly. If you’re new to intraday trading, read day trading for beginners first.
What makes a stock worth day trading
Most day traders scan for a short list of “stocks in play” before the open. The qualities they look for:
| Quality | What to look for | Why it matters |
|---|---|---|
| Liquidity | High average daily volume in shares and dollars. | You can get in and out quickly at a fair price, even with a large order. |
| Relative volume | Volume today well above the stock’s normal volume for this time of day. | Unusual activity means unusual interest, which is what creates intraday moves. |
| Volatility (ATR) | An intraday range wide enough to reach a sensible target, but not so wild that stops are meaningless. | Without movement there is nothing to trade; with too much, risk is hard to control. |
| Tight spread | A bid/ask spread of a few cents or less. | The spread is a cost on every round trip. See liquidity and spreads. |
| A catalyst | Earnings, news, an analyst action, sector moves. | A reason for the move tends to bring sustained buying or selling, rather than random noise. |
VWAP (volume-weighted average price)
What it shows. The average price paid for the stock so far today, weighted by how many shares traded at each price. It starts fresh each session. Many institutions use VWAP as a benchmark for their own execution.
How day traders use it. Price holding above VWAP is commonly read as buyers in control; below it, sellers. Pullbacks to VWAP in a trending stock are popular entry areas, and a decisive break back through VWAP is often treated as a warning.
Weakness. In choppy sessions price crisscrosses VWAP repeatedly, producing many false signals. Late in the day it moves very little, because it averages a whole session. More in VWAP.
Moving averages (9 and 20 EMA)
What they show. The average price over a set number of bars, smoothing out noise to show direction. An exponential moving average (EMA) weights recent prices more heavily, so it reacts faster than a simple moving average.
How day traders use them. The 9- and 20-period EMAs on a 1-, 2- or 5-minute chart are common choices. In a strong intraday uptrend, price tends to stay above them and pull back toward them; the faster average above the slower one is read as an uptrend.
Weakness. Moving averages lag, and in a sideways market crossovers whipsaw you in and out. See moving averages.
Momentum and stretch: RSI, MACD and Bollinger Bands
RSI (Relative Strength Index)
What it shows. Developed by J. Welles Wilder Jr., RSI compares the size of recent gains with recent losses on a scale of 0 to 100, usually over 14 periods. Wilder treated readings above 70 as overbought and below 30 as oversold.
How day traders use it. To spot stretched moves and divergences, for example price making a new high while RSI makes a lower high.
Weakness. In a strong trend RSI can stay above 70 (or below 30) for a long time, so “overbought” is not a sell signal by itself. See RSI.
MACD (Moving Average Convergence Divergence)
What it shows. Created by Gerald Appel, MACD is the difference between a 12-period and a 26-period EMA, with a 9-period EMA of that difference as the signal line. The histogram shows the gap between the two.
How day traders use it. To gauge whether momentum is building or fading: crosses of the signal line, the histogram shrinking or growing, and divergences from price.
Weakness. Built from moving averages of moving averages, it lags even more, and on fast intraday charts its crosses arrive after much of the move. See MACD.
Bollinger Bands
What they show. Developed by John Bollinger: a 20-period simple moving average with bands 2 standard deviations above and below. The bands widen when volatility rises and narrow when it falls.
How day traders use them. A tight “squeeze” can precede a burst of movement; in range-bound stocks, moves to the outer bands may revert toward the middle.
Weakness. A touch of the band is not a signal on its own: in strong trends price can “walk the band” for a long time. Bollinger himself recommends pairing them with other tools. See Bollinger Bands.
Volume, relative volume and ATR
Volume confirms price. A breakout on heavy volume shows real participation; one on thin volume is more suspect. Relative volume compares current volume with the stock’s typical volume at the same point in the day, so you can see whether today is unusual. Weakness: volume spikes at the open and close every day, and a single large block can distort it. See volume analysis.
Average True Range (ATR), another Wilder indicator, measures how much a stock typically moves per bar, usually over 14 periods. True range uses the greatest of the bar’s high minus low, or the distance from the prior close to the high or low, so gaps are counted. Day traders use daily ATR to see whether a stock moves enough to be worth trading, and intraday ATR to place stops outside normal noise. Weakness: ATR shows how much a stock moves, not which direction. See average true range.
Worked example: relative volume and an ATR-based stop
Say a stock normally trades about 1,000,000 shares by 10:30 a.m., and today it has traded 3,000,000 by then: relative volume of 3.
- On the 5-minute chart, ATR is $0.20. You place a stop 1.5 ATR below your entry: $0.30.
- Willing to risk $150 on the trade, you could buy $150 ÷ $0.30 = 500 shares.
- If you instead used a stop of only $0.10, ordinary noise could easily hit it.
Round illustrative numbers, not a forecast. Slippage can make the actual loss larger.
Support, resistance and pre-market levels
Many day traders rely on plain price levels more than on any indicator. Support is a price area where buying has stopped declines before; resistance is where selling has capped rallies. Levels that intraday traders watch closely include the pre-market high and low, the prior day’s high, low and close, the high and low of the first few minutes of trading, and round numbers.
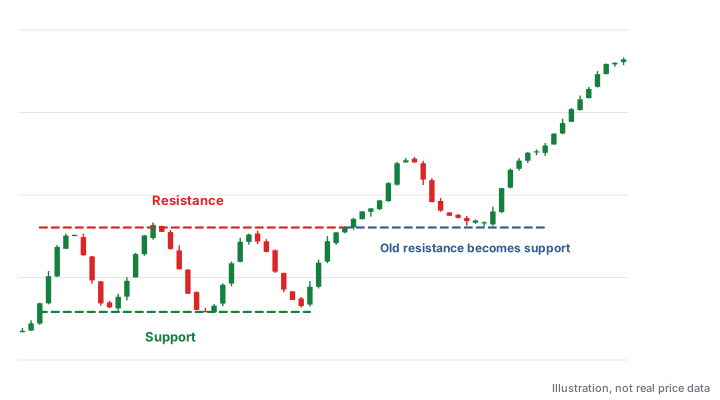
A break above the pre-market high on strong volume is a common breakout entry; a failure there is a common short or exit signal. Weakness: levels are zones, not exact prices, and obvious levels attract stop orders, so price often pokes through briefly before reversing. See support and resistance.
How to combine day trading indicators (and avoid overload)
A clean intraday chart might hold just price, volume, VWAP, one or two EMAs and a few marked levels. Add an oscillator such as RSI only if you know exactly how you’ll use it. Common mistakes:
- Indicator overload. Five indicators that all measure momentum don’t confirm each other; they repeat the same information and give conflicting signals at the edges.
- Treating lagging signals as early. By the time a MACD cross or EMA cross prints on a fast chart, much of the move may be over.
- Ignoring price and volume. Indicators are derived from price and volume. When they disagree with what price is clearly doing, price wins.
- Copying settings without testing. The common settings are starting points. Test any change in a simulator and your journal before trusting it.
- Trading without a stop. No combination of indicators removes risk. Decide the stop and size before entry; see risk management.
The day trading course covers these lessons in order, and position sizing shows how to turn a stop into a share count.
Frequently asked questions
What is the best indicator for day trading?
There isn’t one best indicator. Many day traders build around VWAP, one or two short moving averages, volume and key price levels, and add a momentum indicator such as RSI only as a secondary check.
What are the best RSI settings for day trading?
The standard setting from J. Welles Wilder is 14 periods with 70 and 30 as overbought and oversold levels. Some day traders use shorter periods on fast charts, which makes RSI more sensitive and produces more false signals.
Which moving averages do day traders use?
The 9- and 20-period exponential moving averages on 1-, 2- or 5-minute charts are common choices, along with VWAP. They help show the intraday trend and where pullbacks may find buyers.
How do you find stocks to day trade?
Day traders typically scan for stocks with high liquidity, unusually high relative volume, enough daily range, a tight bid/ask spread and a clear catalyst such as earnings or news.
How many indicators should I use for day trading?
Usually only a few. Several indicators that measure the same thing add clutter rather than confirmation, so many traders keep price, volume, VWAP and one or two others.
Sources and further reading
Educational content only, not investment advice. Chart illustrations use made-up prices. Trading involves risk of loss. Disclaimer