
Technical Analysis · Candlestick Patterns
Candlestick Patterns
Candlestick patterns are shapes made by one to three price candles that hint at a shift in the balance between buyers and sellers. They are most useful as clues in context, not as signals on their own.
Key takeaways
- Each candle shows four prices: open, high, low and close. The body and shadows tell you who controlled the session.
- Key single-candle patterns: doji, hammer, hanging man and shooting star. Key multi-candle patterns: engulfing and morning/evening stars.
- The same shape means different things in different places: trend and location (support, resistance) decide the meaning.
- Wait for confirmation from the next candle, and give more weight to patterns on above-average volume.
- Candlestick patterns are short-term clues. Use a stop and combine them with trend, support and resistance.
What are candlestick patterns?
Candlestick patterns are recognizable shapes formed by one, two or three consecutive candles on a price chart. Each one says something about how buyers and sellers behaved over a short period, and some of them often appear near turning points. Traders use them to spot a possible reversal (a change of direction) or a pause in a trend, then look for other evidence before acting.
Candlestick charts come from Japan, where tradition credits rice traders, notably Munehisa Homma in the 18th century, with early forms of the method. Steve Nison introduced and popularized them for Western traders in his book Japanese Candlestick Charting Techniques. Today almost every charting platform shows candles by default. If you’re new to charts, start with candlestick charts, then come back here.
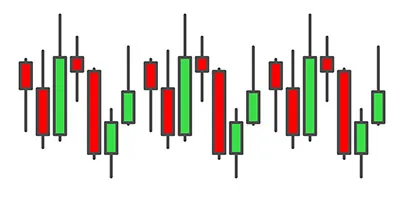
Anatomy of a candlestick
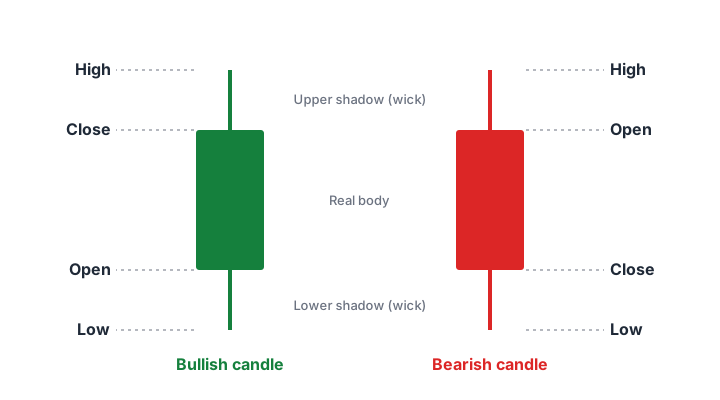
Every candle covers one period: a day on a daily chart, five minutes on a five-minute chart. It records four prices:
- Real body. The thick part, from the open to the close. On most charts it is green (or hollow) when the close is above the open, and red (or filled) when the close is below the open.
- Upper shadow (wick). The thin line above the body, reaching the period’s high.
- Lower shadow (wick). The thin line below the body, reaching the period’s low.
A long body shows one side was firmly in control. A small body shows indecision. A long shadow shows that price traveled far in one direction but was pushed back before the close: a sign of rejection at that level.
Single-candle patterns
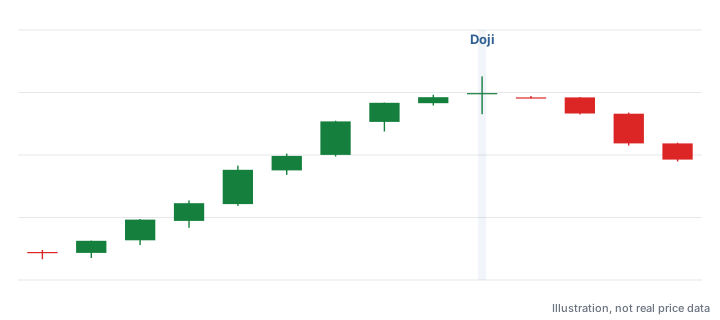
Doji
A doji has an open and close at or very near the same price, so the body is a thin line. It signals indecision. After a long advance, a doji warns that buyers are losing conviction; in a quiet sideways market it means little.
Hammer and hanging man
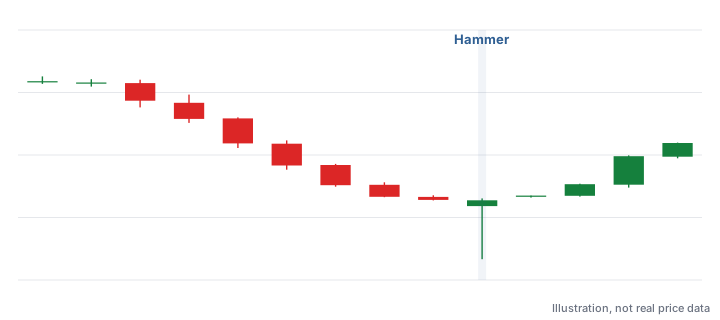
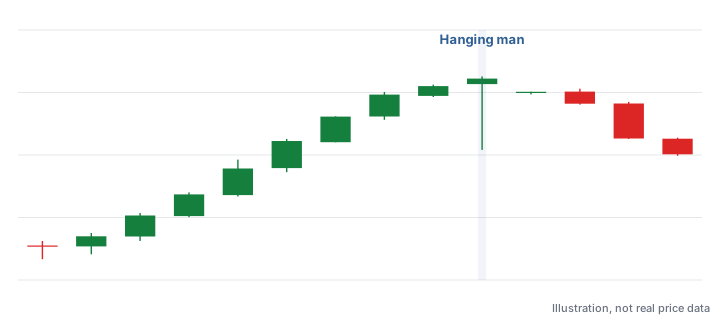
These two share one shape: a small body near the top of the range and a long lower shadow, commonly at least twice the length of the body, with little or no upper shadow. What separates them is where they appear.
- A hammer forms after a decline. Sellers drove price well down during the session, but buyers pushed it back up by the close: a possible bullish reversal.
- A hanging man forms after an advance. The long lower shadow shows that heavy selling appeared during the session, a possible bearish warning, even though price recovered.
More detail in hammer and hanging man.
Shooting star
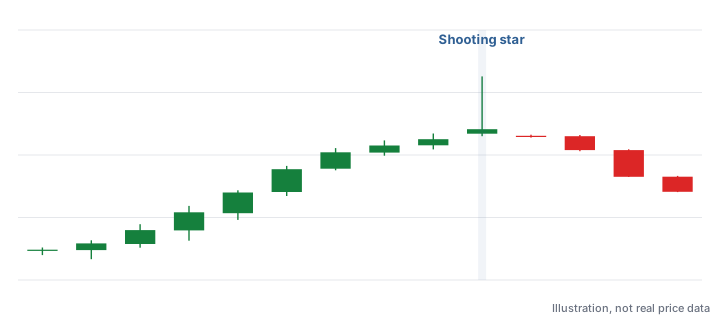
A shooting star is the upside-down version: a small body near the bottom of the range and a long upper shadow, appearing after an advance. Buyers pushed price sharply higher, sellers drove it back down, and the session closed near its low. It is a possible bearish reversal. (The same shape after a decline is called an inverted hammer.)
Two-candle patterns: engulfing
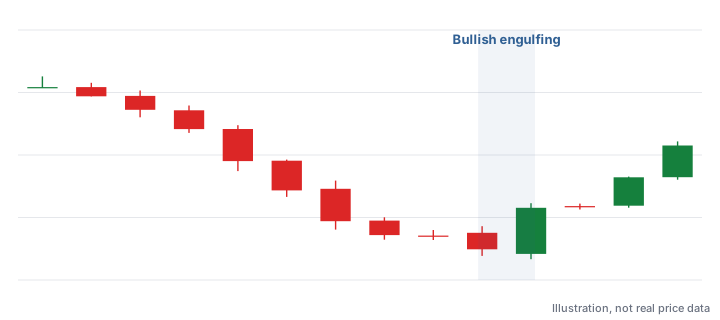
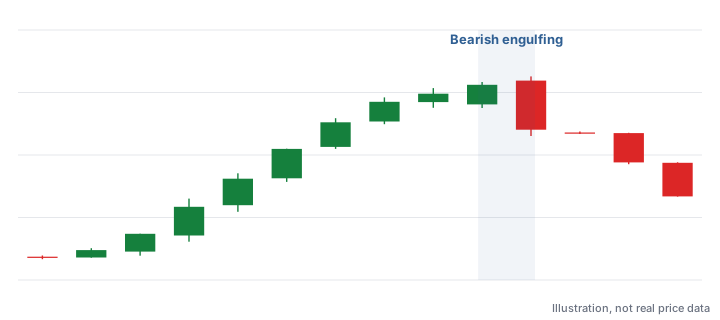
In an engulfing pattern, the second candle’s body completely covers (engulfs) the body of the first, in the opposite color.
- Bullish engulfing. After a decline, a small red candle is followed by a larger green candle whose body spans the whole red body. Buyers overpowered the sellers of the previous session.
- Bearish engulfing. After an advance, a small green candle is followed by a larger red candle that engulfs it. Sellers took over.
Three-candle patterns: morning and evening stars
Star patterns take three sessions to form, which shows the shift in control step by step.
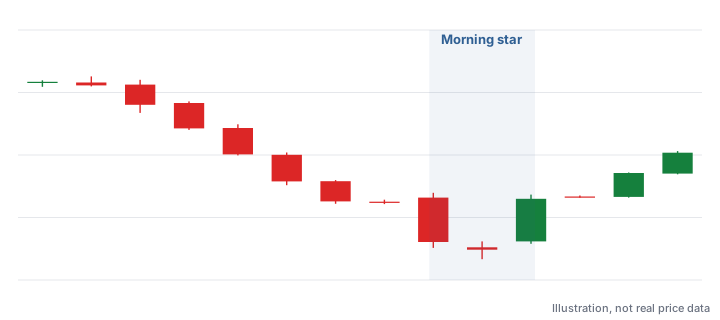
- Morning star (bullish, after a decline): a long red candle; then a small-bodied candle (the star) that often gaps lower and shows selling running out; then a long green candle that closes well into the first candle’s body, often above its midpoint.
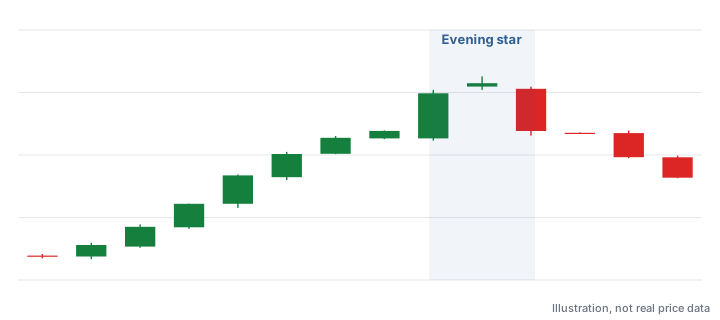
- Evening star (bearish, after an advance): a long green candle; a small-bodied star; then a long red candle that closes well into the first candle’s body.
| Pattern | Candles | Appears after | Possible meaning |
|---|---|---|---|
| Doji | 1 | Either trend | Indecision; a warning after a long move |
| Hammer | 1 | Decline | Bullish reversal |
| Hanging man | 1 | Advance | Bearish warning |
| Shooting star | 1 | Advance | Bearish reversal |
| Bullish engulfing | 2 | Decline | Bullish reversal |
| Bearish engulfing | 2 | Advance | Bearish reversal |
| Morning star | 3 | Decline | Bullish reversal |
| Evening star | 3 | Advance | Bearish reversal |
Why context and confirmation matter
A candlestick pattern on its own is weak evidence. Three things decide whether it deserves attention:
- Trend. A reversal pattern needs something to reverse. A hammer in the middle of a sideways range says little. Check the trend first.
- Location. Patterns carry more weight at a meaningful level: a hammer at support, a shooting star at resistance, or a reversal near a key moving average.
- Volume. A pattern formed on above-average volume shows more participation than one on a quiet day. See volume analysis.
Confirmation means waiting for the next candle to agree. After a hammer, many traders want the next session to close above the hammer’s close or high; after a shooting star, a close below its low. Waiting costs a little of the move but filters out many false signals.
Limits of candlestick signals and common mistakes
Candlestick patterns describe what happened over one to three sessions. They say nothing about how far a move will go, and they fail often. Shapes also depend on the timeframe and on how your platform builds candles, so the same stock can show a hammer on one chart and not on another.
- Trading the shape without the trend. A “reversal” pattern in a sideways market has nothing to reverse.
- Skipping confirmation. Acting on the pattern candle alone means acting before the market has agreed with you.
- Ignoring location. A pattern in the middle of nowhere matters far less than one at support or resistance.
- Overweighting intraday candles. Very short timeframes produce many patterns, most of them noise.
- Expecting a big move. Candlestick signals are short-term. Use chart patterns and trend for the bigger picture.
- No stop. A pattern that fails can fail fast. Decide the exit before you enter.
To go further, read each pattern lesson above, then the Chart Patterns Course, which moves from candles to larger chart patterns. Unfamiliar terms are in the glossary.
Frequently asked questions
What are the most important candlestick patterns for beginners?
A good starting set is the doji, hammer, hanging man, shooting star, bullish and bearish engulfing, and the morning and evening stars. Together they cover the most common single, two- and three-candle signals.
Do candlestick patterns work?
They can help, but no pattern is reliable on its own. They work best as one piece of evidence alongside trend, support and resistance, volume and confirmation from the next candle, and always with a stop.
What is the difference between a hammer and a hanging man?
They have the same shape, a small body near the top and a long lower shadow. A hammer appears after a decline and is a possible bullish reversal; a hanging man appears after an advance and is a possible bearish warning.
Who invented candlestick charts?
Candlestick charting developed in Japan, and tradition credits rice traders such as Munehisa Homma with early forms of it. Steve Nison popularized the method in the West with his book Japanese Candlestick Charting Techniques.
What does a doji candle mean?
A doji opens and closes at about the same price, showing indecision between buyers and sellers. After a strong trend it can warn of a possible reversal, but it needs confirmation from the following candles.
Sources and further reading
Educational content only, not investment advice. Chart illustrations use made-up prices. Trading involves risk of loss. Disclaimer