
Technical Analysis · Chart Patterns
Head and Shoulders Pattern
The head and shoulders is a reversal pattern: three peaks, the middle one highest, sitting on a line called the neckline. When price closes through the neckline, the uptrend that came before it may be over. The inverse version marks a possible bottom.
Key takeaways
- A head and shoulders top forms after an uptrend: a left shoulder, a higher peak (the head) and a lower right shoulder.
- The neckline connects the lows between the peaks. It can be flat or sloped.
- The pattern is only confirmed on a close through the neckline. Until then it is just a possibility.
- The measured move (head-to-neckline height projected from the break) is a rough guide, not a promise.
- Failures happen: a move back through the neckline, beyond the right shoulder, is a common place for the stop.
What is a head and shoulders pattern?
The head and shoulders pattern is a reversal pattern that signals a rising stock may be turning down. It has three peaks: a left shoulder, a higher head, and a right shoulder that is lower than the head and often roughly level with the left shoulder. A line drawn through the two lows between the peaks is the neckline. When price closes below the neckline, the pattern is complete.
The mirror image, the inverse head and shoulders (sometimes called a head and shoulders bottom), forms after a decline and signals a possible turn up. Both versions were described in detail by Robert Edwards and John Magee in Technical Analysis of Stock Trends, and they remain among the best-known chart patterns.
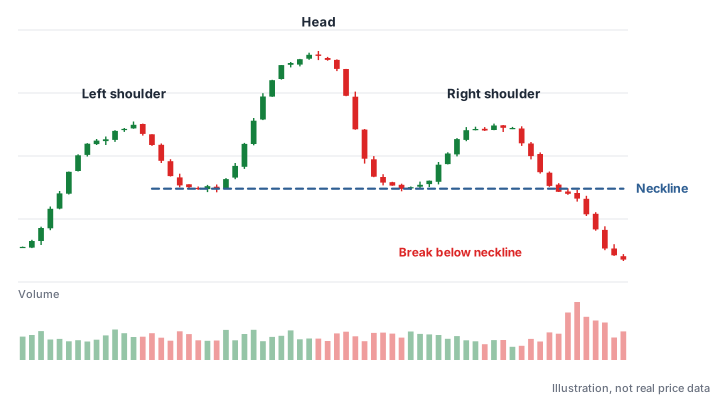
The psychology behind the pattern
Each part of the pattern reflects a shift in the balance between buyers and sellers:
- Left shoulder. The uptrend is still intact. The stock makes a new high, then pulls back normally.
- Head. Buyers push to a higher high, but the advance can’t hold. The pullback from the head falls back to about the level of the previous low, erasing the gains of the last rally. That’s the first real warning.
- Right shoulder. Buyers try again but can’t reach the head’s high. A lower high after a higher high shows demand is weakening.
- Neckline break. When price falls below the lows that held twice, buyers who supported the stock at that level are now losing money, and some sell. The uptrend’s pattern of higher highs and higher lows is broken.
The inverse pattern tells the opposite story: sellers push to a lower low (the head), can’t follow through, and a higher low (the right shoulder) shows selling pressure fading before buyers break the neckline.
How to identify a head and shoulders top
| Part | What to look for |
|---|---|
| Prior trend | A clear advance before the pattern. A reversal pattern needs something to reverse. |
| Left shoulder | A peak and pullback within the uptrend, often on heavy volume. |
| Head | A higher peak, followed by a decline back to around the low of the left shoulder’s pullback. |
| Right shoulder | A lower peak than the head. Shoulders are rarely identical; rough symmetry in height and time is enough. |
| Neckline | A line through the low after the left shoulder and the low after the head. It may be horizontal or sloped. |
| Volume | Commonly heaviest on the left shoulder or head, and noticeably lighter on the right shoulder rally. |
| Confirmation | A close below the neckline. Rising volume on the break adds weight. |
Drawing the neckline, flat or sloped
Connect the two reaction lows: the low between the left shoulder and the head, and the low between the head and the right shoulder. The line is often roughly flat, but it doesn’t have to be.
- A downward-sloping neckline on a top means the second low was lower than the first, a sign of weakness already creeping in. Price has to fall further to break it, but many analysts view these as the more bearish version.
- An upward-sloping neckline on a top breaks sooner. Some traders treat it with more caution, since the second low was still higher than the first.
For a sloped neckline, the breakout level is wherever the line sits at the moment price crosses it, not the price of either low. Extend the line to the right and watch where price closes relative to it.
Volume behavior
Volume is a key part of the pattern, though the classic guidelines are tendencies rather than requirements:
- On a top, volume is often heavy on the left shoulder and the head, then lighter on the right shoulder rally: fewer buyers are willing to pay up. Volume often expands on the neckline break, but a top can break down on modest volume, because a lack of buyers can be enough for price to fall.
- On an inverse pattern, volume on the breakout above the neckline matters more. Edwards and Magee stressed that an upside break should come with a clear increase in volume. A rally through the neckline on light volume is suspect.
For more on reading volume, see volume analysis and accumulation and distribution.
The inverse head and shoulders
The inverse pattern is the same structure turned upside down: after a decline, a low (left shoulder), a lower low (head), and a higher low (right shoulder), with the neckline connecting the two rally highs between them. It is confirmed on a close above the neckline, ideally on volume well above average.
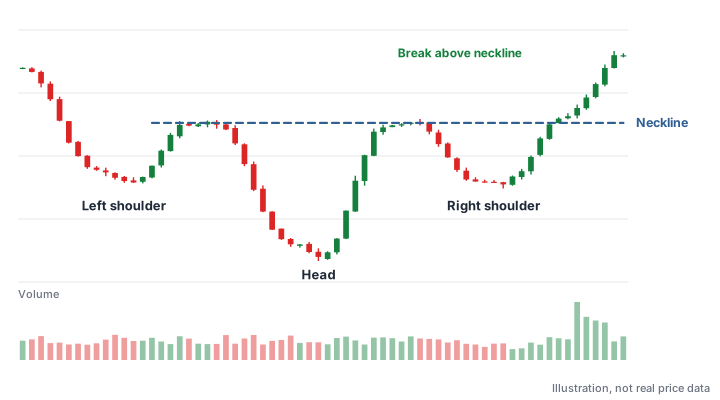
Because it forms after a decline, an inverse head and shoulders is often a bottom in a stock that has been weak. Traders who focus on leading growth stocks may prefer to wait until the stock builds a proper base, such as a cup with handle, closer to its highs.
How to trade a head and shoulders
- Wait for the close through the neckline. Selling, shorting or buying before the break is anticipating a pattern that may never complete. Many right shoulders turn into new highs.
- Check the context. Is there a prior trend to reverse? What is the general market doing? A bearish pattern in a strong market, or a bullish one in a weak market, is fighting the tide.
- Set the stop before you enter. A common place is just beyond the right shoulder: above it for a short sale after a top, below it for a purchase after an inverse pattern. If that is too far away, a smaller fixed stop or skipping the trade are the alternatives.
- Size the position from the stop. Choose a share count so that being stopped out costs only a small, fixed part of your account. See position sizing.
- Use the target as a rough guide. Plan where you would take profits, but expect price to stop short of, or overshoot, any projection.
For investors who already own the stock, a completed top is more often a reason to sell or reduce than a reason to short. Short selling carries the risk of losses larger than the amount invested; understand it fully before trying it.
The measured-move target
The traditional projection measures the vertical distance from the head to the neckline directly beneath it, then projects that distance from the point where price breaks the neckline: down for a top, up for an inverse pattern. It’s a rough guide. Many patterns fall short of the target, and some run well beyond it.
Worked example: an inverse head and shoulders
Say the neckline is flat at $50.00, the head’s low is $40.00, and the right shoulder’s low is $46.60.
- Height of the pattern: $50.00 − $40.00 = $10.00. The measured move projects about $50.00 + $10.00 = $60.00.
- Price closes above the neckline and you buy at $50.50. A stop just under the right shoulder, at $46.50, risks $4.00 a share (about 7.9%).
- If you’re willing to lose $400 if the trade fails, that is 100 shares ($400 ÷ $4.00), about $5,050 worth.
- The distance to the projection is $60.00 − $50.50 = $9.50, a little over twice the $4.00 risked.
Round illustrative numbers, not a forecast. Commissions, slippage and gaps can make a real loss larger than planned.
Throwbacks, pullbacks and failed patterns
After breaking the neckline, price often returns to test it. After a top breaks down, a rally back up to the neckline is commonly called a pullback or throwback (writers use the two words differently, so focus on the behavior). The old support at the neckline frequently acts as resistance. After an inverse pattern breaks out, a dip back to the neckline that holds is the mirror image.
A retest that holds can offer a second, lower-risk entry for traders who missed the break. A retest that pushes back through the neckline and keeps going is a warning sign that the pattern is failing.
- Trading the pattern before it completes. Until the neckline breaks, three peaks are just three peaks.
- Forcing the pattern. If you have to stretch to see the shoulders, or the “head” is barely higher than the shoulders, skip it.
- No prior trend. A head and shoulders top in a stock that hasn’t risen has little to reverse.
- Ignoring a failed break. If price breaks the neckline and then recovers back past the right shoulder, the pattern has failed. Failed tops can lead to sharp rallies as short sellers cover.
- Treating the target as a sure outcome. The measured move is a rough guide. Take profits by plan, not by hope.
See the failed breakouts collection in the Model Book for how patterns break down in practice.
Frequently asked questions
Is a head and shoulders pattern bullish or bearish?
A head and shoulders top is bearish: it suggests an uptrend may be reversing. The inverse head and shoulders is bullish: it suggests a downtrend may be ending. Either is confirmed only by a close through the neckline.
How do you calculate the head and shoulders price target?
Measure the vertical distance from the head to the neckline, then project that distance from the neckline breakout point: down for a top, up for an inverse pattern. Treat the result as a rough guide, not a forecast.
Can the neckline of a head and shoulders be sloped?
Yes. The neckline connects the two lows between the peaks (or the two highs, in an inverse pattern) and is often sloped. The breakout level is where the line sits when price crosses it.
Where do you put a stop-loss on a head and shoulders trade?
A common place is just beyond the right shoulder. If that is too far away for your risk limit, use a smaller fixed stop or skip the trade, and size the position so a stop-out is a small, planned loss.
What happens when a head and shoulders pattern fails?
Price breaks the neckline, or nearly does, then reverses back through it and beyond the right shoulder. Failed patterns can move quickly in the opposite direction, which is why the stop is decided in advance.
Sources and further reading
Educational content only, not investment advice. Chart illustrations use made-up prices. Trading involves risk of loss. Disclaimer