
Technical Analysis · Chart Patterns
Double Bottom and Double Top
A double bottom is a W-shaped pattern: price tests the same area of support twice, then breaks out above the middle peak. A double top is the M-shaped mirror image, and it is confirmed only when price closes below the middle low.
Key takeaways
- A double bottom is a W. In William O’Neil’s method it is a base in a rising stock, and the second low ideally undercuts the first to shake out weak holders.
- The double bottom’s buy point is just above the middle peak of the W, on volume well above average.
- A double top is an M. Two peaks alone prove nothing; it is confirmed only on a close below the middle low.
- Both patterns fail regularly. Decide the stop and the position size before you enter.
What is a double bottom?
A double bottom is a chart pattern shaped like the letter W. Price falls to a low, rallies, falls back to roughly the same low, then rises and breaks out above the peak in the middle of the W. The two lows show that buyers defended the same area twice; the breakout shows they have overpowered the sellers.
Traders use the pattern in two ways. In classic chart pattern analysis it is a reversal: the end of a decline. In William J. O’Neil’s method it is mainly a base: a correction in a stock that was already rising, after which the uptrend may resume. This lesson focuses on the base version, because its guidelines are the most specific.
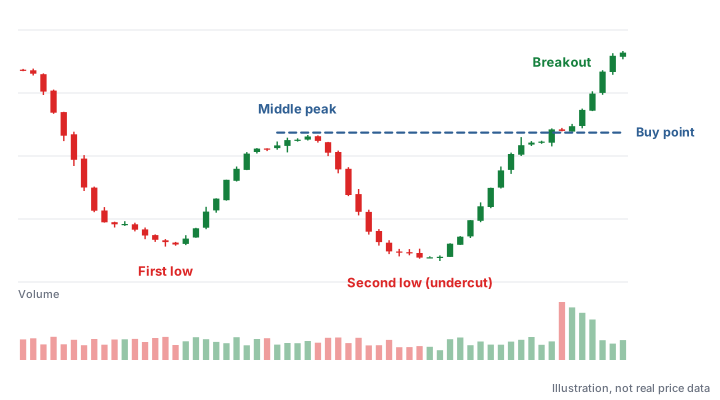
Why the W forms: the psychology
- First leg down. After an advance, the stock corrects as early buyers take profits, often along with the general market.
- Middle rally. Bargain hunters step in and the stock bounces, but not back to its old high. Investors still holding from higher up use the bounce to sell.
- Second leg down. Price returns to the first low. When it dips slightly below that low, holders who placed stops there are forced out, and nervous holders give up. This is the shakeout.
- The turn and breakout. If larger investors are buying, the stock recovers quickly from the undercut, climbs back to the middle peak and clears it on rising volume. With the weak holders gone, there is less supply in the way.
How to identify a double bottom base
These are the guidelines O’Neil and traders who follow his approach commonly use. Real charts are messier than any diagram.
| Part | What to look for |
|---|---|
| Prior uptrend | For the base version, a clear advance before the pattern begins. The W is a pause in a leader. |
| Length | Commonly at least seven weeks from the left-side high, and often longer. |
| Depth | A reasonable correction, similar to a cup: very deep declines mean more overhead supply and more volatility. |
| Second low | Ideally slightly undercuts the first low, shaking out weak holders. A second low well above the first is a weaker version. |
| Middle peak | Below the base’s left-side high. This peak sets the buy point. |
| Volume | Often heavy as the stock undercuts the first low and turns, then well above average on the breakout. |
The double bottom buy point and volume
In O’Neil’s method, the buy point is the high of the middle peak of the W, plus a few cents (he used 10 cents). A move through that level is the breakout. Note that this is usually below the base’s left-side high, so the stock may still face some resistance higher up.
- Volume confirms the breakout. Look for volume well above the stock’s average on the breakout day, commonly at least 40% to 50% above it. A breakout on light volume is far more likely to slip back into the base. See volume analysis.
- Don’t chase. Many traders skip the trade once the stock is more than about 5% above the buy point.
- Check the market. Most stocks follow the general market, and breakouts during a correction fail more often.
Worked example: a double bottom buy point and stop
Say a stock’s left-side high is $60.00. It falls to $48.00, rallies to $55.00, then falls to $47.20, undercutting the first low, before recovering.
- The buy point is the middle peak plus 10 cents: $55.10.
- A stop about 8% below that, at $50.80, risks $4.30 a share (about 7.8%).
- If you’re willing to lose $500 if the trade fails, you could buy 116 shares ($500 ÷ $4.30, rounded down), about $6,390 worth.
Round illustrative numbers, not a forecast. Commissions, slippage and gaps can make a real loss larger than planned.
What is a double top?
A double top is the M-shaped mirror image: after an advance, price reaches a high, pulls back to a low, rallies to roughly the same high again and fails, then falls. It’s a reversal pattern that suggests buyers have run out of strength at a level where sellers are waiting.
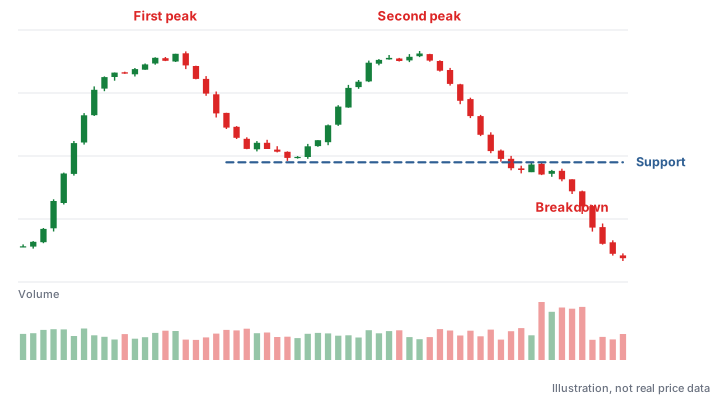
The key point: two peaks are not a double top. Plenty of stocks reach an old high, pause, pull back slightly and then break out. The pattern is confirmed only when price closes below the middle low (the low between the two peaks). Before that, it’s just a stock meeting resistance.
- Volume. Volume is often lighter on the second peak than the first, a sign of weaker demand, and heavier as the stock falls through the middle low.
- Time between peaks. Peaks a few weeks or more apart carry more weight than two highs a few days apart, which are often just normal chop.
- Measured move. Some traders subtract the height of the pattern (peak minus middle low) from the middle low. Peaks at $80 and a middle low at $70 would project about $60. Treat it as a rough guide.
How to trade double bottoms and tops
- Identify the trend first. A double bottom base needs a prior uptrend; a double top needs an advance to reverse.
- Wait for confirmation. Double bottom: a move above the middle peak on strong volume. Double top: a close below the middle low.
- Set the stop before you enter. For a double bottom, a fixed loss of about 7% to 8% is common among O’Neil followers (his rule was to cut every loss at 7% to 8%), or a level below the recent lows. For a short sale after a double top, a common place is above the second peak.
- Size the position from the stop. Keep the loss at the stop to a small, fixed part of your account. See position sizing.
- Plan your exits. Decide in advance where you would take profits and what would make you leave early, such as a close back inside the pattern on heavy volume.
For investors who already own a stock, a confirmed double top is more often a signal to sell or reduce than a reason to sell short. Short selling can lose more than the amount invested.
Failed patterns and common mistakes
Both patterns fail. A double bottom breakout can stall at the left-side high and fall back below the buy point; a double top breakdown can reverse and rally through both peaks. The second case often catches short sellers, who then buy to cover and push price higher.
- Calling a double top before it breaks. Two peaks are only resistance until price closes below the middle low.
- Buying the second low. Buying near the second low anticipates the pattern; the undercut often goes further than expected. The confirmed buy point is the middle peak.
- No prior uptrend for a base. A W after a long decline is a bottoming attempt in a weak stock, which carries more risk than a base in a leader.
- A breakout on light volume. Without strong demand, the stock often slips back into the pattern.
- Ignoring the overhead high. The double bottom’s buy point sits below the left-side high, which can act as resistance.
- Moving the stop. A stop moved further away after the trade goes wrong turns a small loss into a large one.
Study real examples, including failures, in the Model Book’s double bottom examples and failed breakouts. Related bases: the flat base and the ascending base.
Frequently asked questions
Is a double bottom bullish?
Yes. A double bottom is a bullish pattern, used either as a reversal at the end of a decline or, in William O’Neil’s method, as a base in a rising stock. It is confirmed when price breaks out above the middle peak of the W.
Where is the buy point on a double bottom?
In O’Neil’s method, just above the middle peak of the W, commonly 10 cents above it. If the pattern forms a handle, the buy point is the top of the handle instead.
Why should the second low of a double bottom undercut the first?
A slight undercut triggers stops placed under the first low and scares out nervous holders. That removes potential sellers, so there is less supply in the way when the stock breaks out.
How is a double top confirmed?
By a close below the middle low, the lowest point between the two peaks. Until that happens, two peaks at the same level are just resistance, and the stock may still break out above them.
What is the difference between a double top and a double bottom?
A double bottom is a W shape that tests support twice and is bullish; a double top is an M shape that tests resistance twice and is bearish. Each is confirmed by a break of the level in the middle of the pattern.
Sources and further reading
Educational content only, not investment advice. Chart illustrations use made-up prices. Trading involves risk of loss. Disclaimer