
Technical Analysis · Chart Patterns
Cup with Handle Pattern
The cup with handle is a bullish base: a rounded, U-shaped correction followed by a short, quiet pullback. When the stock clears the top of the handle on heavy volume, the pattern is complete.
Key takeaways
- A cup with handle forms after a prior uptrend: it is a pause in a rising stock, not a bottom in a falling one.
- The cup should be rounded (U-shaped), not a sharp V, and the handle should form in the upper half of the cup.
- Volume tells the story: it dries up in the handle and should surge on the breakout.
- The buy point (pivot) is just above the handle’s high. A stop below the handle, or a fixed small percentage, limits the loss if it fails.
- Many breakouts fail. The pattern improves the odds; it never removes the risk.
What is a cup with handle?
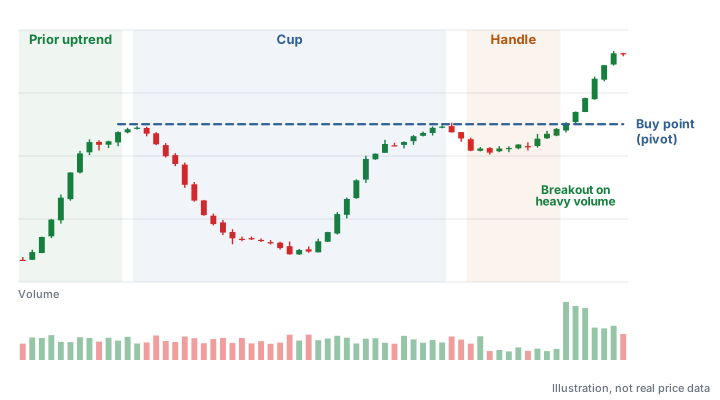
A cup with handle is a chart pattern that shows a stock pausing and rebuilding after an advance. Price pulls back, rounds out a bottom, climbs back toward its old high (the cup), then dips briefly one last time (the handle) before breaking out to new highs.
The pattern was popularized by investor William J. O’Neil, whose studies of the biggest stock market winners found that many of them formed a cup with handle before their largest advances. It’s a continuation pattern: it suggests the uptrend that came before it may resume.
Why the pattern forms: the psychology
Every part of the cup reflects what buyers and sellers are doing:
- The left side of the cup. After a good run, early buyers take profits and the stock corrects, often along with the general market.
- The bottom. Selling dries up. Price moves sideways while larger investors quietly build positions. A rounded bottom shows that this took time, which shakes out weak holders.
- The right side. Demand returns and the stock climbs back toward its old high.
- The handle. Near the old high, investors who bought at the top and sat through the decline sell to “get out even.” The handle absorbs that last supply. When it’s quiet (light volume, tight price action), there aren’t many sellers left.
- The breakout. With overhead supply absorbed, buyers push price above the handle’s high, ideally with volume well above normal, a sign that institutions are buying.
How to identify a cup with handle
The guidelines below are the ones O’Neil and the traders who follow his method commonly use. They are guidelines, not laws: real charts are messier than any diagram.
| Part | What to look for |
|---|---|
| Prior uptrend | A clear advance before the base begins, commonly at least 30%. The pattern is a pause in a leader, not a bottom in a laggard. |
| Cup shape | A rounded U. A sharp V means price fell and recovered too fast to shake out weak holders. |
| Cup depth | Commonly 12% to 33% from the left-side high to the low. Deeper cups (up to about 50%) can work after a bear market, but are riskier. |
| Cup length | Usually at least six or seven weeks from the left-side high; many last several months. |
| Handle position | In the upper half of the cup, and ideally above the stock’s 50-day (10-week) moving average. |
| Handle shape | Drifts sideways or slightly down, with a few lower highs. A handle that wedges upward is a warning sign. |
| Handle length and depth | At least about a week; usually a pullback of no more than 10% to 12% in a normal market. |
| Volume | Heavier on the decline and the rebound; very light in the handle; well above average on the breakout day. |
Finding the buy point (pivot)
The buy point, also called the pivot, is the high of the handle. Traders who follow O’Neil’s method add a few cents above that high and treat a move through it as the breakout.
- Volume confirms it. On the breakout day, volume should be well above the stock’s average, commonly at least 40% to 50% higher. A breakout on below-average volume is far more likely to fail.
- Don’t chase. Buying far above the pivot raises the risk: a normal pullback can hit your stop. Many traders set a “buy range” of about 5% above the pivot and skip the trade once the stock is extended beyond it.
- Market direction matters. Most stocks follow the general market. Breakouts during a market correction fail more often.
A trading plan for a cup with handle
- Confirm the setup. Prior uptrend, rounded cup of reasonable depth, handle in the upper half, volume drying up in the handle.
- Mark the pivot. Note the handle’s high and set an alert just above it.
- Wait for the breakout. Price clears the pivot with volume well above average. No volume, no trade.
- Decide the stop before you buy. Two common approaches: below the low of the handle, or a fixed loss of about 7% to 8% from the purchase price, whichever you can live with. O’Neil’s rule was to cut any loss at 7% to 8%, no exceptions.
- Size the position from the stop. Choose a share count so that hitting the stop costs only a small, fixed part of your account. See position sizing.
- Plan the exit. Many traders take some profit after a gain of roughly 20% to 25%, and watch for warning signs such as a close back below the pivot on heavy volume.
Worked example: setting the stop and the size
Say the handle’s high is $50.00, so the pivot is $50.10. The handle’s low is $46.50.
- A stop just under the handle low, at $46.40, risks $3.70 a share (about 7.4%).
- If you’re willing to lose $500 if the trade fails, you could buy 135 shares ($500 ÷ $3.70), about $6,760 worth.
- If the stock breaks out and rises 25% from the pivot, it reaches about $62.60.
Round illustrative numbers, not a forecast. Commissions, slippage and gaps can make a real loss larger than planned.
Price targets
There’s no reliable way to know how far a breakout will run. Two methods are common:
- Measured move. Some traders add the cup’s depth (in dollars) to the breakout price. A cup that fell from $50 to $40 projects about $60. Treat this as a rough guide, not a promise.
- Profit-taking rules. Followers of O’Neil’s method often take most profits after a 20% to 25% gain, except when a stock rises that much very quickly, which can be a sign of an unusually strong leader worth holding longer.
Faulty patterns and failed breakouts
Most of the value in studying the pattern is learning to skip the weak versions:
- A V-shaped cup. The stock fell and recovered too fast; holders who want out haven’t been shaken out yet.
- A handle in the lower half of the cup. Shows the stock couldn’t recover enough of its decline: weak demand.
- A wedging handle. A handle that drifts up along its lows instead of down, often on rising volume, tends to fail.
- Too-deep cups and handles. Excessive declines mean more overhead supply and more volatility.
- No prior uptrend. A cup shape after a long decline is just a bounce, not a base in a leading stock.
- A breakout on light volume. Without institutional demand, the stock often slips back into the base.
- Buying too extended. Entering far above the pivot leaves no room for normal volatility.
Even a textbook pattern can fail: a bad earnings report, a market sell-off or an industry shock can reverse any breakout. That’s why the stop is decided before you buy. If the stock closes back below the pivot on heavy volume, many traders treat it as a failed breakout and reduce or exit.
Variations: cup without handle and saucers
- Cup without a handle. Some stocks break out straight from the right side of the cup. The buy point is then the cup’s left-side high. These can work, but there is no handle to absorb the last sellers.
- Saucer with handle. A longer, shallower version of the cup, typically lasting many months.
- Cup with a high handle. When the handle forms after the stock has already moved above the cup’s high, it’s usually treated as a separate, shorter base.
Related bases worth knowing: the double bottom, the flat base and the ascending base.
Frequently asked questions
Is the cup with handle bullish or bearish?
Bullish. It’s a continuation pattern that forms during an uptrend and is completed by a breakout above the handle’s high. An upside-down version exists, but traders rarely use it.
How long does a cup with handle take to form?
Typically at least six to seven weeks from the left-side high to the end of the handle, and often several months. The handle itself usually lasts at least about a week.
Where is the buy point on a cup with handle?
Just above the highest price in the handle. Traders look for the stock to clear that level with volume well above its average, and usually avoid buying more than about 5% above it.
Where should the stop-loss go?
Common choices are just below the handle’s low, or a fixed 7% to 8% below the purchase price. Whichever you choose, decide it before you buy and size the position so that hitting it is a small, planned loss.
How reliable is the cup with handle pattern?
No chart pattern is reliable on its own, and many breakouts fail. The pattern tends to work better in strong stocks during a rising market, with a well-formed base and heavy breakout volume. Always use a stop.
Sources and further reading
Educational content only, not investment advice. Chart illustrations use made-up prices. Trading involves risk of loss. Disclaimer