
Technical Analysis · Chart Patterns
Chart Patterns
Chart patterns are recurring shapes that price traces on a stock chart. They don’t predict the future, but they show where buyers and sellers are fighting, and give you a defined place to act and a defined place to admit you were wrong.
Key takeaways
- A chart pattern is a picture of supply and demand: where sellers ran out, where buyers stepped in, and where the balance shifted.
- Patterns fall into three groups: continuation (the trend resumes), reversal (the trend turns) and bilateral (could break either way).
- A pattern is only complete when price breaks out and closes beyond its boundary, ideally on above-average volume.
- The general market matters: most stocks follow it, and breakouts in a falling market fail more often.
- Every pattern can fail. Decide your stop and position size before you enter.
What are chart patterns?
Chart patterns are recognizable shapes that a stock’s price forms on a chart over days, weeks or months: a W, an M, a head between two shoulders, a triangle that narrows to a point. Traders study stock chart patterns because each shape describes a particular balance between buyers and sellers, and because each one gives a clear trigger price (where the pattern is completed) and a clear invalidation price (where it has failed).
That second part is the real value. A pattern doesn’t tell you what will happen; it tells you where to act and where to get out if you’re wrong. If you are new to reading charts, start with candlestick charts and support and resistance: nearly every pattern is built from them.
Why chart patterns work: supply, demand and psychology
Prices move when the balance between people who want to buy and people who want to sell changes. Patterns form because investors behave in fairly consistent ways:
- Memory of past prices. Investors who bought at a high and watched the stock fall often sell when it gets back to their purchase price, just to break even. That creates resistance at old highs.
- Bargain hunting. Buyers who missed a stock at a low price often step in when it returns there, creating support.
- Institutional buying takes time. Mutual funds and pension funds can’t buy a large position in a day without pushing the price up. Their steady buying leaves footprints: tight price action, support at the same levels, and volume spikes on up days.
- Crowds react together. When a stock clears a level many people are watching, buyers who were waiting pile in and short sellers rush to cover, which can make the move fast.
None of this is mechanical. Patterns describe tendencies in human behavior, so they work often enough to be useful and fail often enough that you must manage risk every time.
Types of chart patterns: continuation, reversal and bilateral
Patterns are usually sorted by what they suggest about the trend that came before them:
- Continuation patterns are pauses in an existing trend. A stock rises, rests while early buyers take profits, then resumes. Examples: the cup with handle, flags and pennants, and most bases.
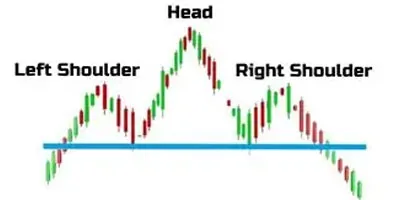
- Reversal patterns mark a possible change of direction: an uptrend turning down or a downtrend turning up. Examples: the head and shoulders and the double top.
- Bilateral patterns could break either way. The symmetrical triangle is the classic case: price narrows between falling highs and rising lows, and you wait for the breakout to tell you the direction.
The labels are tendencies, not rules. A “continuation” pattern can break the wrong way, and the same shape can mean different things depending on whether it forms after a long advance or a long decline. Always read a pattern in the context of the trend before it.
Bases vs. classic chart patterns
You’ll meet two traditions of pattern reading on this site, and they overlap.
Classic patterns come from the technical analysts of the early and middle twentieth century, collected in Robert Edwards and John Magee’s Technical Analysis of Stock Trends. They include head and shoulders, double and triple tops and bottoms, triangles, flags, pennants and wedges, and they are used for both buying and selling short.
Bases are the buying patterns described by William J. O’Neil, founder of Investor’s Business Daily, from his studies of big winning stocks. A base is a period of sideways or corrective price action in a stock that was already rising. The main ones:
- Cup with handle: a rounded U-shaped correction followed by a short, quiet pullback.
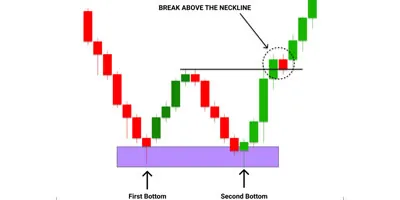
- Double bottom: a W shape in which the second low ideally undercuts the first.
- Flat base: a tight, shallow sideways range, commonly lasting at least five weeks and correcting no more than about 10% to 15%.
- Ascending base: three pullbacks, each with a higher low than the one before, typically of about 10% to 20% each.
The approaches share the same core ideas, a defined breakout level and volume confirmation, but O’Neil’s bases add conditions about the stock itself: a prior uptrend, strong relative strength and, in his method, strong earnings.
The main chart patterns at a glance
| Pattern | Type | Where it is completed | Lesson |
|---|---|---|---|
| Cup with handle | Continuation (base) | Close above the handle’s high | Cup with handle |
| Double bottom | Base / bullish reversal | Above the middle peak of the W | Double bottom and top |
| Double top | Bearish reversal | Close below the middle low of the M | Double bottom and top |
| Flat base | Continuation (base) | Above the top of the range | Flat base |
| Ascending base | Continuation (base) | Above the high where the third pullback began | Ascending base |
| Head and shoulders top | Bearish reversal | Close below the neckline | Head and shoulders |
| Inverse head and shoulders | Bullish reversal | Close above the neckline | Head and shoulders |
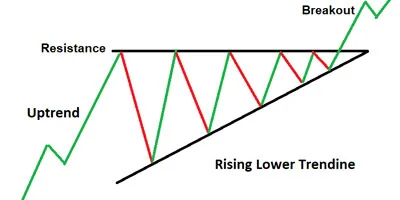
| Ascending / descending triangle | Usually continuation | Close beyond the flat side | Wedges and triangles |
| Symmetrical triangle | Bilateral | Close beyond either trendline | Wedges and triangles |
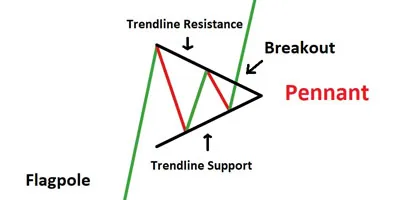
| Flag and pennant | Continuation | Close beyond the small consolidation | Flags and pennants |
How to confirm a chart pattern
A shape that looks like a pattern is only a candidate. Most traders want several things to line up before they act:
- A close beyond the boundary. Intraday pokes through a level are common and often reverse. Many traders wait for the bar to close beyond the breakout line, or at least watch how price behaves into the close.
- Volume above average. A breakout on volume well above the stock’s recent average suggests large investors are behind it. A breakout on light volume is easier to reverse. See volume analysis.
- The right context. A continuation pattern needs a trend to continue; a reversal pattern needs a trend to reverse. A “double bottom” with no decline before it isn’t a reversal of anything.
- A healthy general market. Most stocks move with the major indexes. Bullish breakouts during a market correction fail more often, and bearish patterns are more dangerous to short in a strong market.
- A plan for failure. Know the price that proves the pattern wrong, and put your stop there or within your maximum loss.
Chart patterns and timeframes
The same shapes appear on intraday, daily, weekly and monthly charts. Two general points hold:
- Longer patterns tend to carry more weight. A base that took three months to build reflects far more trading, and far more investors changing hands, than a pattern on a five-minute chart.
- Use more than one timeframe. Many swing and position traders identify the pattern on a weekly chart and time the entry on a daily chart. Day traders do the same with daily and intraday charts. Chart timeframes covers this in more detail.
Shorter timeframes produce many more patterns, and many more false signals. Trading costs and the bid/ask spread also matter more when the expected move is small.
Common mistakes with chart patterns
- Seeing patterns everywhere. If you have to squint, it isn’t there. Clear patterns with clean boundaries are easier to trade and easier to exit.
- Acting before the breakout. Buying a half-formed pattern because you expect it to complete adds risk. The breakout is the signal.
- Ignoring volume. Breakouts on light volume, and patterns whose volume tells the opposite story, fail more often.
- Ignoring the market. A great-looking pattern in a falling market is fighting the tide.
- Treating targets as promises. Measured-move targets are rough guides. Price can stop short or go much further.
- No stop, or a stop moved further away. Patterns fail regularly. The stop is what keeps a failure small. Size each position from the stop, as explained in position sizing.
- Chasing extended prices. Buying far beyond the breakout point leaves little room for a normal pullback.
To see how patterns played out in real stocks, including the ones that failed, study the Model Book. For a guided path through every pattern lesson, take the free Chart Patterns Course, and look up unfamiliar terms in the glossary.
Frequently asked questions
What are the most common stock chart patterns?
The ones traders cite most often are the cup with handle, double bottom and double top, head and shoulders (and its inverse), triangles, and flags and pennants. Flat bases and ascending bases are common among growth-stock traders who follow William O’Neil’s method.
Do chart patterns really work?
They describe real tendencies in how buyers and sellers behave, which is why traders use them, but no pattern works every time. Their main value is giving you a defined entry and a defined exit if the pattern fails.
What is the difference between continuation and reversal patterns?
A continuation pattern is a pause within a trend that suggests the trend will resume, such as a flag or a cup with handle. A reversal pattern, such as a head and shoulders or a double top, suggests the existing trend is ending.
How do you confirm a chart pattern breakout?
Most traders look for price to close beyond the pattern’s boundary, volume well above average on the breakout, and a general market that supports the direction of the trade. Even then, a stop is needed in case it fails.
Which timeframe is best for chart patterns?
There is no single best one. Patterns on daily and weekly charts are widely used by swing and position traders; longer patterns usually reflect more trading and carry more weight, while short intraday patterns produce more false signals.
Sources and further reading
Educational content only, not investment advice. Chart illustrations use made-up prices. Trading involves risk of loss. Disclaimer