
Technical Analysis · Chart Patterns
Flags and Pennants
Flags and pennants are short pauses after a sharp move. A stock races up (or down), rests for days to a few weeks in a small, quiet range, then often continues in the direction of the original move.
Key takeaways
- A flag or pennant needs a flagpole: a sharp, nearly straight move on strong volume.
- A flag is a small channel that slopes against the trend; a pennant is a small, converging triangle.
- The pause is short and tight, typically days to a few weeks, with volume drying up.
- The signal is a breakout in the direction of the pole, ideally on volume well above average.
- Flags fail often. A stop just beyond the far side of the flag keeps the loss small.
What are flags and pennants?
Flags and pennants are continuation patterns: short consolidations that interrupt a strong move without reversing it. Both have two parts. The flagpole is a fast, steep run in price. The flag or pennant is the brief, orderly pause that follows, as early buyers take some profit and the stock digests its gain. When price breaks out of the pause in the direction of the pole, the pattern is complete.
They come in bullish and bearish versions. A bull flag follows a sharp rise and usually drifts slightly lower; a bear flag follows a sharp drop and usually drifts slightly higher.
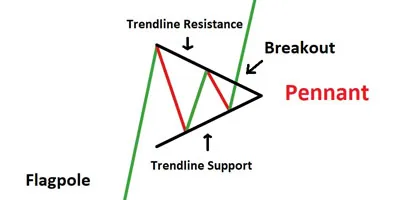
Flag vs. pennant: the difference
The only difference is the shape of the pause:
- Flag. Price moves between two roughly parallel lines, forming a small rectangle or channel that tilts against the prior move: down in a bull flag, up in a bear flag.
- Pennant. The two lines converge, forming a small symmetrical triangle. A pennant is short and small compared with its flagpole; a converging pattern that takes many weeks is usually treated as a triangle instead.
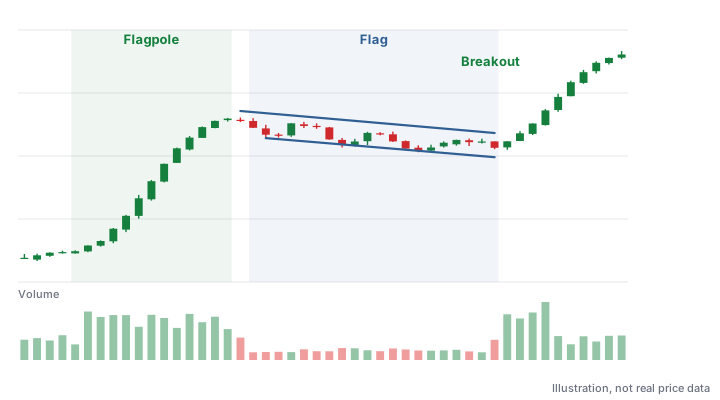
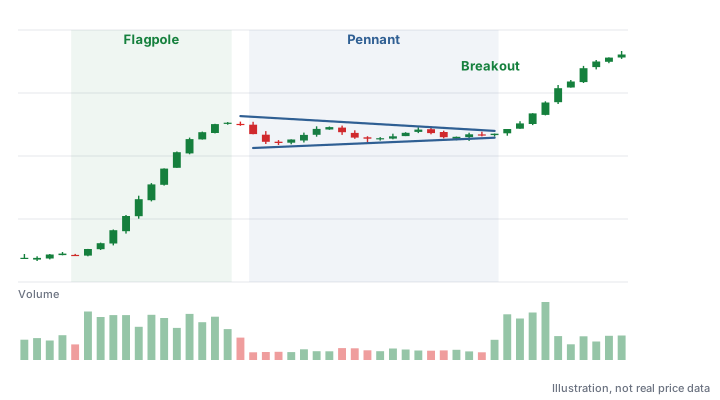
How to identify a flag or pennant
| Feature | What to look for |
|---|---|
| Flagpole | A sharp, nearly vertical move over a short period, on volume well above average. Without a pole, there is no flag. |
| Shape of the pause | Flag: a tight, parallel channel sloping against the trend. Pennant: small converging lines. |
| Depth | Shallow compared with the pole. A bull flag that gives back most of the pole is a warning sign. |
| Duration | Short: typically a few days to a few weeks. The longer it lasts, the less it behaves like a flag. |
| Volume in the pause | Light and declining: holders are not rushing to sell. |
| Volume on the breakout | Rising, ideally well above average, as the original move resumes. |
Why flags form: the psychology
The flagpole usually has a cause: strong earnings, news or a break through an important level brings in a wave of buyers. After such a fast move, short-term traders lock in gains. In a healthy flag, that selling is light and orderly. Price slips only a little, volume shrinks, and buyers who missed the first move step in on the dip. Once the profit-taking is absorbed, the original demand reasserts itself. In a bear flag, the same thing happens in reverse: a weak bounce on light volume as sellers pause before the decline resumes.
How to trade flags and pennants
- Confirm the pole. Look for a steep move on strong volume. A gentle climb is not a flagpole.
- Draw the pattern. Connect the highs and lows of the pause. Each line needs at least two touches.
- Wait for the breakout. For a bull flag, a move above the upper line, ideally a close above it, with volume clearly higher than during the pause.
- Set the stop before you enter. A common choice for a bull flag is just below the low of the flag. Some traders use a tighter stop, such as below the last swing low inside the flag.
- Size from the stop. Choose a share count so the distance to the stop costs only a small part of your account. See position sizing.
- Plan the exit. A rough guide some traders use is the measured move: the length of the pole added to the breakout point. Many also trail a stop as the move develops.
Worked example: a bull flag
Say a stock jumps from $20.00 to $30.00 in two weeks: a $10.00 flagpole. Over the next eight sessions it drifts down to $28.00 on light volume, in a tight channel whose upper line sits at $29.50 on the breakout day.
- The stock closes at $29.80 on heavy volume: the breakout.
- A stop just under the flag low, at $27.90, risks $1.90 a share.
- If you’re willing to lose $300 if the trade fails, you could buy 157 shares ($300 ÷ $1.90 = 157.9, rounded down).
- The measured move adds the $10.00 pole to the $29.50 breakout point: about $39.50. That’s a reference point, not a target the stock must reach.
Round illustrative numbers, not a forecast. Gaps and slippage can make a real loss larger than planned.
Bear flags and bear pennants
The bearish versions follow the same rules upside down. The pole is a sharp drop on heavy volume. The flag is a short, weak bounce in a tight channel that tilts slightly upward, or a small pennant, on light volume. The signal is a close below the lower line, ideally as volume picks up again.
- For holders, a bear flag inside a downtrend is a reason for caution: the bounce may simply be a pause before the next leg down.
- For short sellers, the stop usually goes just above the high of the flag. Short selling carries extra risks, including losses that have no fixed limit (a stock’s price can keep rising) and the cost of borrowing shares, so learn how it works with your broker before trying it.
Many traders note that declines tend to move faster than advances, so bear flags can be especially brief.
Flags compared with flat bases and triangles
Flags are easy to confuse with other consolidations. The differences are mainly speed and shape:
- Flat base. Moves sideways in a tight range rather than sloping, and lasts longer: in William O’Neil’s method, at least about five or six weeks. It often follows a more gradual advance or a breakout from an earlier base.
- Triangle. Converging lines like a pennant, but usually larger and longer, and it doesn’t need a steep pole before it.
- High, tight flag. O’Neil described a rare, more extreme variety: a stock that roughly doubles in a short period, then pulls back only about 10% to 25% in a tight pattern before breaking out again. Because the stock is already so extended, these are among the most volatile setups to trade, and they are easy to misidentify.
Why flags fail and common mistakes
A flag that fails usually gives itself away: the pause drags on, gets deeper or loose, or volume rises on the down days. A breakout that quickly reverses back into the flag is another warning. Broader conditions matter too: in a falling market, bull flags fail more often.
- Calling any pullback a flag. Without a steep, high-volume pole, the pattern has no basis.
- Ignoring the depth. A pullback that erases most of the pole signals that sellers, not profit-takers, are in charge.
- Waiting too long. A flag is a short pattern. After several weeks with no breakout, reassess.
- Buying a breakout on light volume. If volume doesn’t expand, the move often stalls.
- Chasing a gap far above the flag. The further you buy from the stop, the more you risk per share.
- Skipping the stop. Flags move fast in both directions. Decide the exit before you enter.
Study failed breakouts in the Model Book to see how quickly a promising pattern can turn, and read breakout trading for the general rules.
Frequently asked questions
Is a bull flag a bullish pattern?
Yes. A bull flag is a continuation pattern that forms after a sharp rise and is completed by a breakout above the top of the flag. Like any pattern, it can fail, so traders use a stop.
What is the difference between a flag and a pennant?
Both follow a steep flagpole and last a short time. In a flag, price moves between parallel lines that slope against the trend; in a pennant, the lines converge into a small triangle.
How long does a flag pattern last?
Typically a few days to a few weeks. A pause that lasts much longer usually stops behaving like a flag and is better treated as another type of base or consolidation.
Where do you put a stop-loss on a bull flag?
A common choice is just below the low of the flag. Wherever you put it, decide before entering and size the position so that hitting it is a small, planned loss.
What is a bear flag?
A bear flag is the downside version: a sharp drop, a short, weak bounce on light volume that slopes slightly upward, then a break below the flag’s lower line as the decline resumes.
Sources and further reading
Educational content only, not investment advice. Chart illustrations use made-up prices. Trading involves risk of loss. Disclaimer