
Technical Analysis · Chart Patterns
Wedges and Triangles
Triangles and wedges are consolidation patterns: price swings in a narrowing range between two trendlines until it breaks out. The slope of the lines hints at which way the break is more likely to go, but only the breakout itself confirms it.
Key takeaways
- Triangle chart patterns form when price swings between two converging trendlines, each touched at least twice.
- An ascending triangle (flat top, rising lows) leans bullish; a descending triangle (flat bottom, falling highs) leans bearish; a symmetrical triangle is neutral.
- In a wedge both lines slope the same way: a rising wedge usually breaks down, a falling wedge usually breaks up.
- Volume usually contracts inside the pattern. Wait for a close beyond the line on rising volume before acting.
- False breakouts are common. Put the stop back inside the pattern and size the position from it.
What are triangle chart patterns?
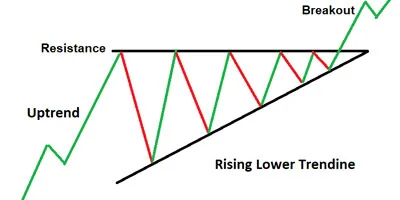
Triangle chart patterns are periods of consolidation in which each swing high and swing low is closer together than the last. If you draw a trendline across the highs and another across the lows, the two lines converge toward a point called the apex. The range narrows because buyers and sellers are reaching a temporary balance. Eventually one side wins and price breaks out of the pattern, often with a burst of volume.
Triangles can be continuation patterns (the prior trend resumes) or, less often, reversal patterns. Wedges are close cousins: the lines also converge, but both slope in the same direction. This lesson covers all five shapes and how traders handle the breakout. For the wider family of shapes, see chart patterns.
The three types of triangles
Ascending triangle
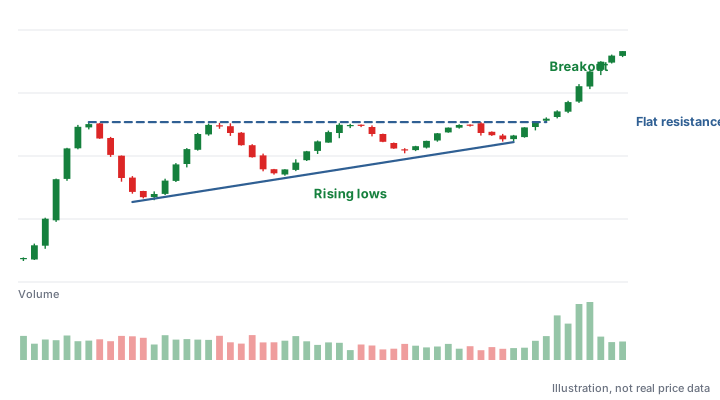
An ascending triangle has a flat upper line (resistance at roughly the same price) and a rising lower line (higher lows). Sellers keep supplying shares at one price, but buyers step in at higher and higher prices on each dip. The pattern is usually read as bullish: if demand absorbs the supply at the flat top, price breaks out upward. It most often appears during an uptrend.
Descending triangle
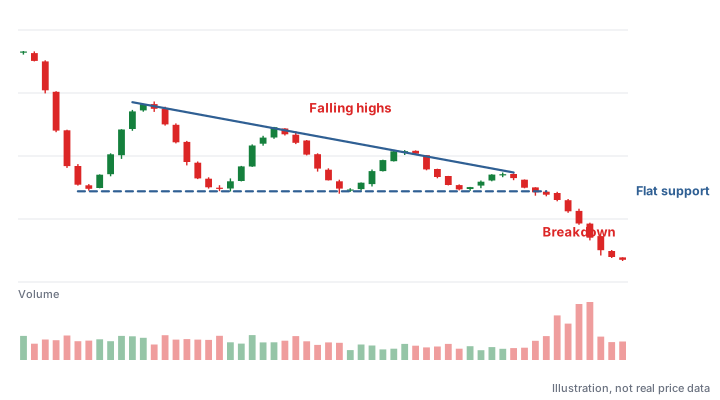
A descending triangle is the mirror image: a flat lower line (support) and a falling upper line (lower highs). Buyers defend one price, but sellers are willing to accept less on every rally. It is usually read as bearish, and the signal is a breakdown below support. It most often appears during a downtrend, though it can also form at the end of an advance.
Symmetrical triangle
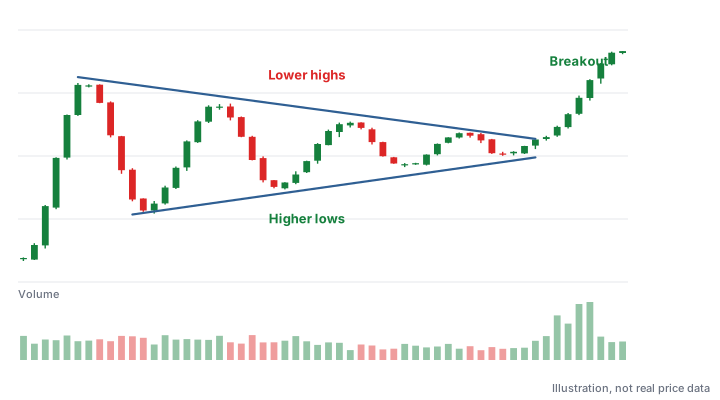
A symmetrical triangle has lower highs and higher lows: both lines slope toward each other at a similar angle. Neither side is in control, so the pattern itself is neutral. Many traders lean toward a break in the direction of the trend that came before it, but they wait to see which line actually breaks.
Rising and falling wedges
In a wedge, both trendlines slope the same way and converge. That small difference changes the meaning:
| Pattern | Shape | Usual reading | What it suggests |
|---|---|---|---|
| Ascending triangle | Flat top, rising bottom | Bullish | Buyers are increasingly aggressive against fixed supply. |
| Descending triangle | Flat bottom, falling top | Bearish | Sellers are increasingly aggressive against fixed demand. |
| Symmetrical triangle | Falling top, rising bottom | Neutral | Balance; the break often follows the prior trend. |
| Rising wedge | Both lines slope up; the lower line is steeper | Bearish | Price is still rising, but each push gains less ground. Often breaks down. |
| Falling wedge | Both lines slope down; the upper line is steeper | Bullish | Price is still falling, but each drop loses less ground. Often breaks up. |
A rising wedge can appear as a bounce inside a downtrend or as a tiring advance at the end of an uptrend. A falling wedge can appear as a pullback inside an uptrend or as a fading decline near a bottom. In both cases the trend inside the wedge is losing momentum, which is why the expected break is against the wedge’s slope. As with triangles, the reading is only a tendency.
How to identify and draw a triangle
- Find at least two touches on each line. A line through one high and one low is just a guess. You need at least two swing highs for the upper line and two swing lows for the lower line; three or more makes the pattern clearer.
- Draw through the swing points, not every wick. Lines that slice through a few intraday spikes are normal. What matters is that most of the price action sits between them.
- Check the prior trend. A triangle after a strong advance is a different setup from one after a long decline. The prior trend tells you which way a continuation would go.
- Watch volume contract. Volume usually shrinks as the range narrows, a sign that fewer traders are willing to act until the range resolves. See volume analysis.
- Mark the breakout levels. Note where each line will be over the next few sessions. For a sloped line, the breakout price changes every day.
Breakout confirmation and where breakouts occur
A breakout is a move outside the pattern. Most traders want more than a brief poke through the line before they act:
- A close beyond the line. An intraday move that reverses by the close is often a trap. Some traders also require the close to be a small distance past the line.
- Rising volume. An upside breakout on volume well above average shows real demand. Downside breaks don’t always need heavy volume, but a pickup in volume still adds weight.
- Timing within the pattern. Classic technical analysis, going back to Edwards and Magee, holds that the more reliable breakouts tend to occur somewhere between about halfway and three-quarters of the way from the start of the pattern to the apex. If price drifts all the way into the apex without breaking, the pattern has lost much of its meaning.
- The retest. After a breakout, price often pulls back to the broken line before moving on. Some traders wait for that retest to hold as a second confirmation, accepting that some breakouts never come back.
How to trade triangles and wedges
A plan for a triangle or wedge has the same parts as any breakout trade: entry, stop, size and exit, all decided before you enter.
- Entry. On a confirmed close beyond the line, or on a successful retest of it.
- Stop. Back inside the pattern: for an upside breakout, commonly below the most recent swing low inside the triangle. If price falls back into the pattern and through that low, the breakout has failed.
- Size. Choose a share count so that hitting the stop costs only a small, fixed part of your account. See position sizing.
- Measured move. A common rough guide takes the height of the pattern at its widest point and adds it to the breakout price (or subtracts it, for a breakdown). Treat it as a reference for judging reward against risk, not as a target the stock must reach.
Worked example: an ascending triangle
Say a stock stalls at $40.00 three times while its lows rise from $34.00 to $36.50 to $38.00. The widest part of the triangle is $40.00 − $34.00 = $6.00.
- The stock closes at $40.50 on heavy volume: the breakout.
- A stop just under the last swing low, at $37.90, risks $2.60 a share.
- If you’re willing to lose $400 if the trade fails, you could buy 153 shares ($400 ÷ $2.60 = 153.8, rounded down).
- The measured move adds the $6.00 height to the $40.00 breakout level: about $46.00, roughly $5.50 above the entry, against $2.60 of risk.
Round illustrative numbers, not a forecast. Gaps and slippage can make a real loss larger than planned.
False breakouts and common mistakes
Triangles produce plenty of false breakouts, sometimes called fakeouts: price closes outside the pattern, then reverses back through it. A symmetrical triangle can even break one way and then the other. That’s why the stop matters more than the pattern.
- Trading before the breakout. Guessing the direction inside a symmetrical triangle is a coin toss. Let price choose.
- Drawing lines with too few touches. Two points on each line is the minimum; with fewer, you are seeing a shape that may not be there.
- Ignoring volume. An upside breakout on light volume often slips back into the pattern.
- Acting on an intraday poke. Wait for the close. Many breaks that look decisive at midday are gone by 4:00 p.m.
- Holding a failed breakout. If price returns inside the pattern and takes out your stop level, exit as planned instead of hoping.
- Treating the measured move as a promise. Many breakouts stall well short of it; some run far past it.
Studying real cases helps. The failed breakouts collection in the Model Book shows what breakdowns look like after the fact.
Triangles compared with other patterns
A pennant is essentially a very small symmetrical triangle that forms after a sharp, nearly vertical move and lasts only days to a few weeks. A flat base moves sideways in a tight range without converging lines. An ascending triangle shares its flat top with a resistance level, so the same rules about broken resistance turning into support apply after a breakout.
Frequently asked questions
Are triangle patterns bullish or bearish?
It depends on the type. Ascending triangles lean bullish, descending triangles lean bearish, and symmetrical triangles are neutral until price breaks out. In every case the breakout, not the shape, gives the signal.
What is the difference between a wedge and a triangle?
In a triangle, the lines slope toward each other from opposite directions, or one line is flat. In a wedge, both lines slope the same way, up or down, while still converging.
Is a rising wedge bullish or bearish?
A rising wedge is usually considered bearish: price is still climbing, but each advance gains less ground, and the pattern often breaks down through its lower line. A falling wedge is the bullish counterpart.
How do you confirm a triangle breakout?
Most traders look for a close beyond the trendline rather than an intraday move, ideally with volume well above average. Some also wait for price to retest the broken line and hold.
How do you calculate a triangle price target?
The common measured-move method adds the height of the triangle at its widest point to the breakout price, or subtracts it for a breakdown. It is a rough guide, not a reliable forecast.
Sources and further reading
Educational content only, not investment advice. Chart illustrations use made-up prices. Trading involves risk of loss. Disclaimer